May 2020
Instructor: Dana Tomlin
Tag: Remote Sensing, Spatila Analysis, Logistic Regression
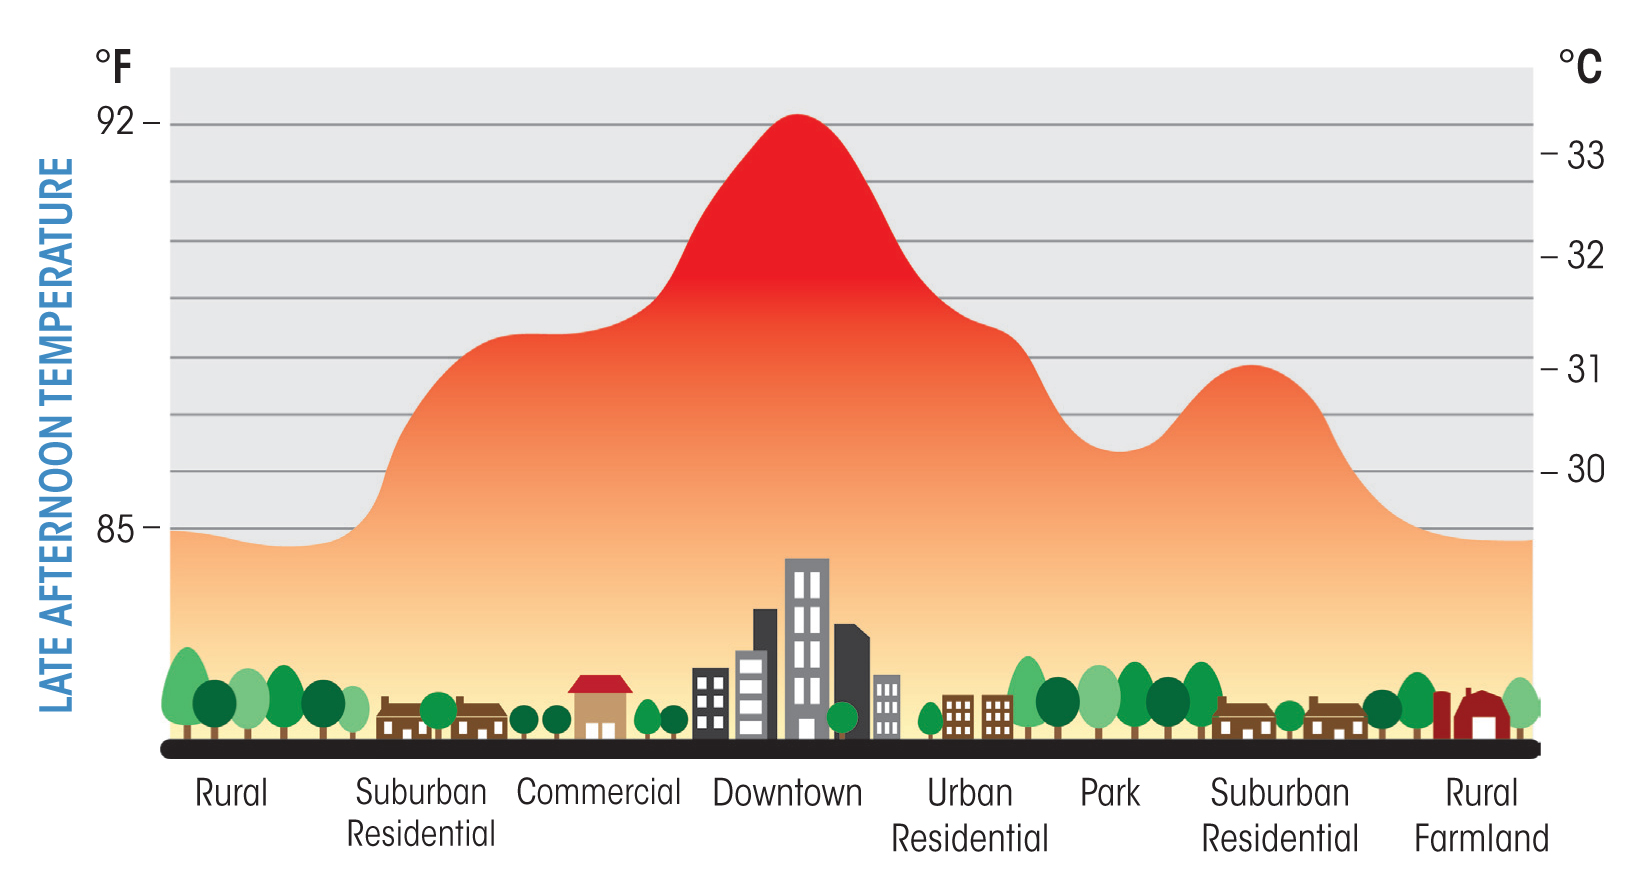
Baltimore, a historic and urbanizing city, faces significant urban heat island (UHI) effects driven by impervious surfaces and socioeconomic disparities. This study explores spatial patterns of land surface temperature (LST) and UHI intensity from 2013–2019, examining the contributions of land-use factors (e.g., impervious surfaces, vegetation) and socioeconomic variables (e.g., population density, income).
Key questions include: What spatial patterns of LST and UHI intensity exist? How do land-use and socioeconomic variables influence UHI? Objectives focus on analyzing these drivers and proposing equitable strategies for UHI mitigation to reduce heat exposure disparities and guide sustainable urban planning.
1. Visualization of LST and NDVI Trends
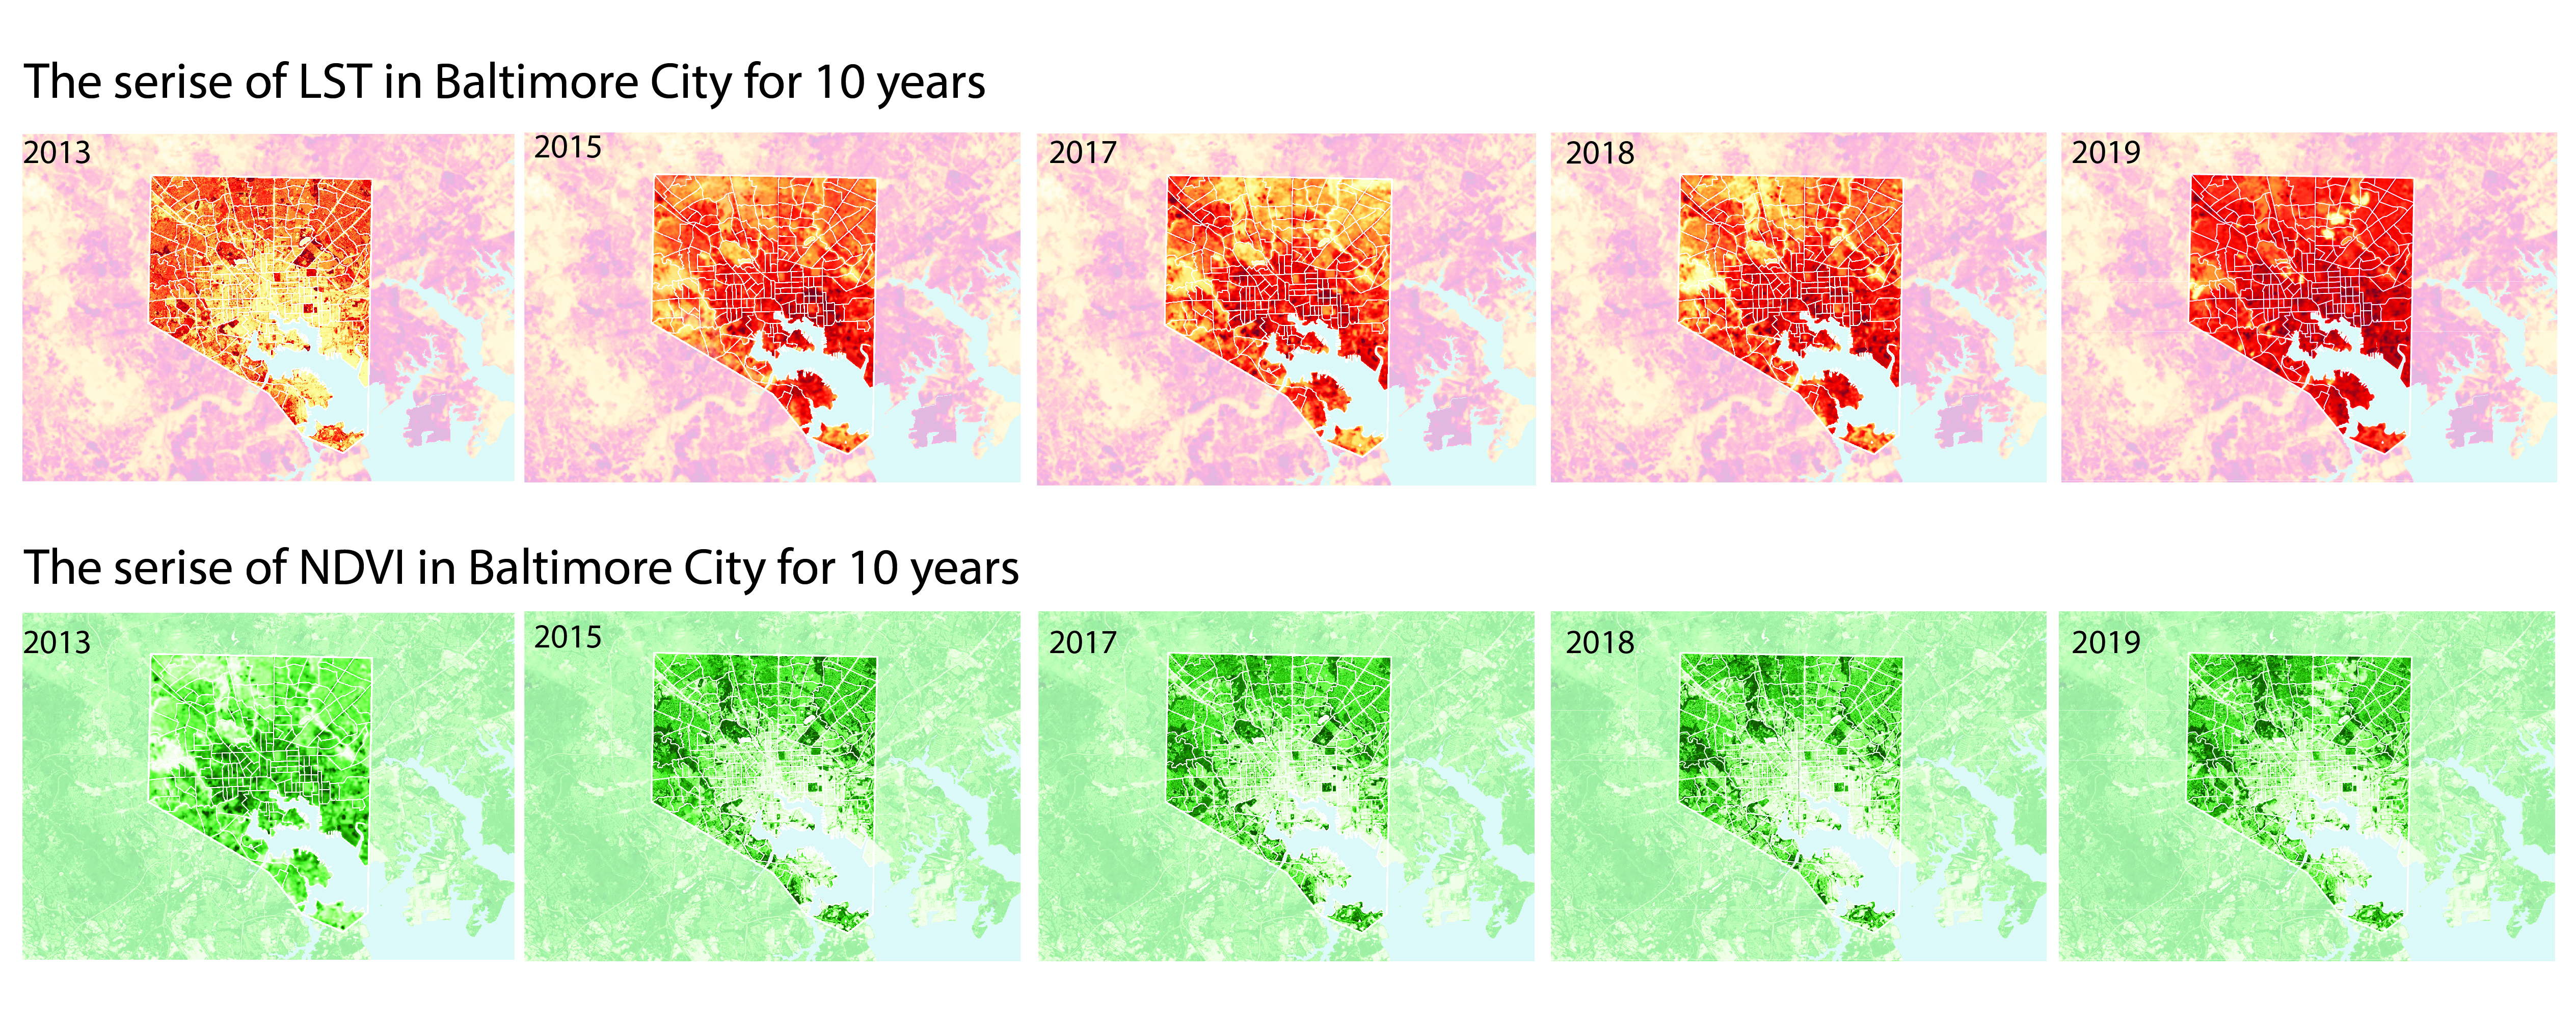
Maps of Land Surface Temperature (LST) and Normalized Difference Vegetation Index (NDVI) from 2013 to 2019 reveal thermal and vegetation patterns across Baltimore. High LST values are concentrated in dense urban areas, while green spaces like Druid Hill Park exhibit lower temperatures. NDVI maps highlight vegetation density, showing an inverse relationship between LST and NDVI, emphasizing vegetation’s cooling effect. Temporal trends capture urban greening efforts and vegetation decline, identifying neighborhoods under significant thermal stress. Rising summer temperatures and minimal nighttime cooling during this period intensified UHI effects, underscoring the need for targeted mitigation strategies to reduce heat disparities.
2. LST by Land Use Type
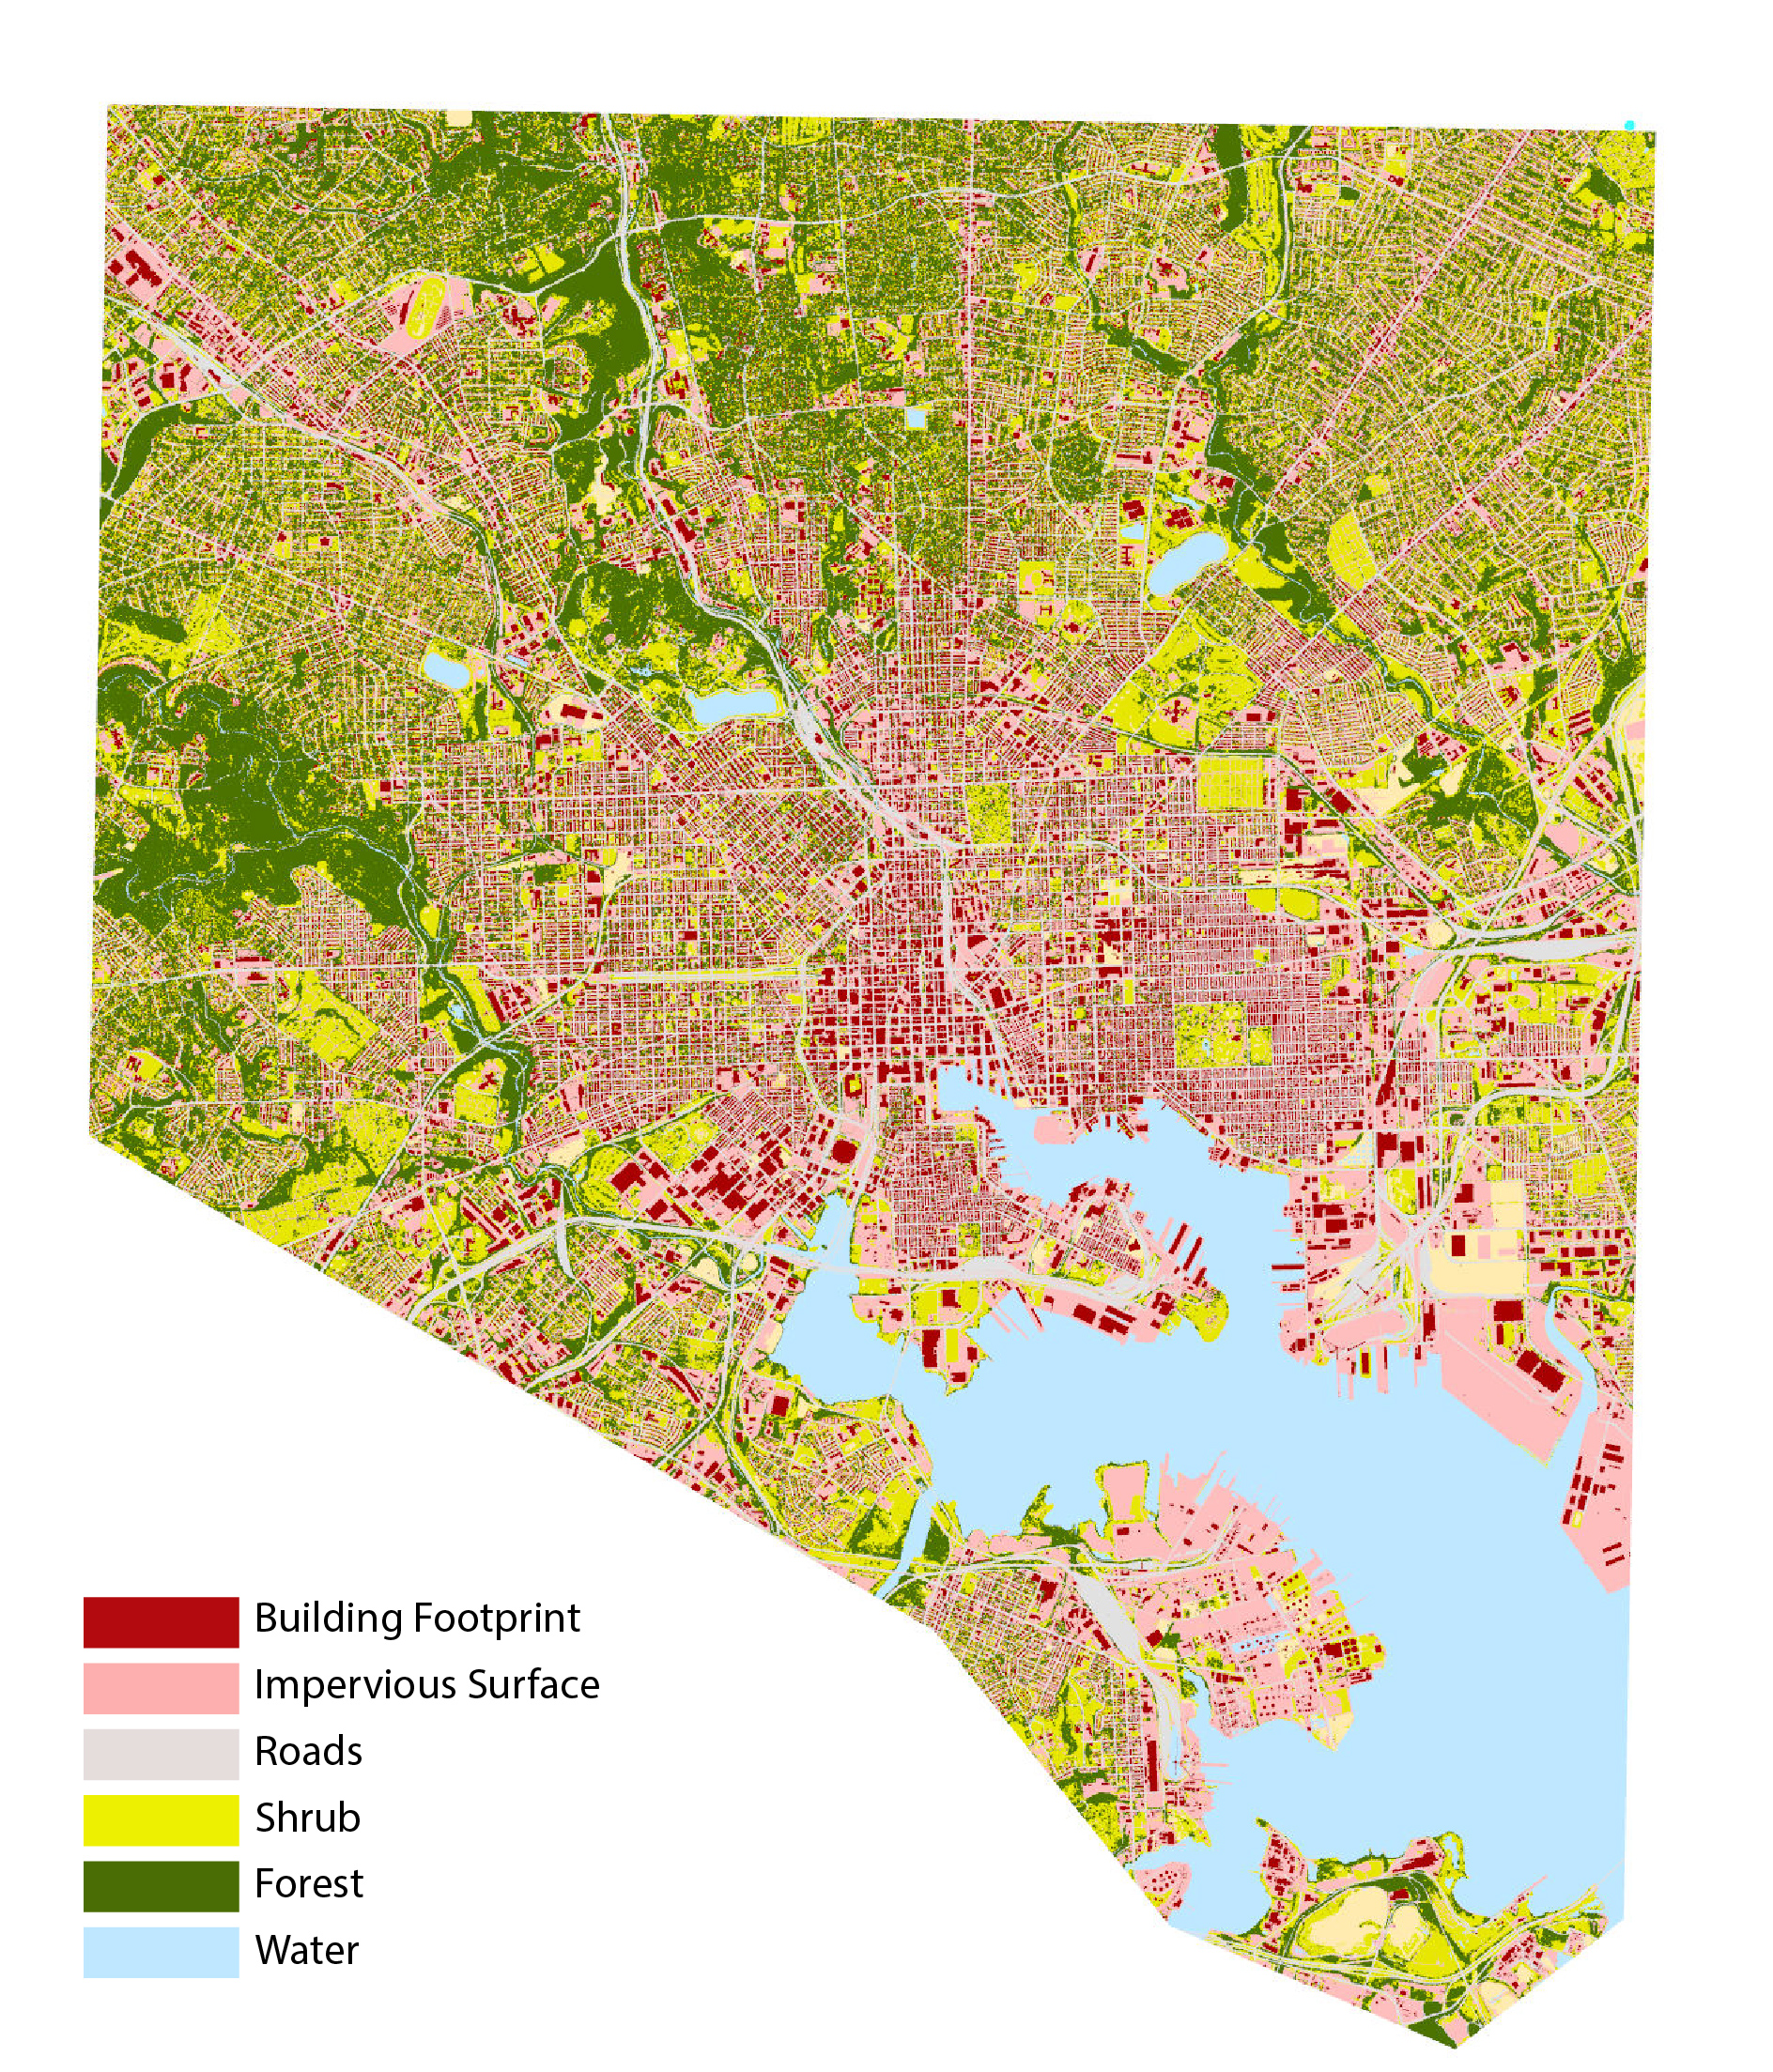
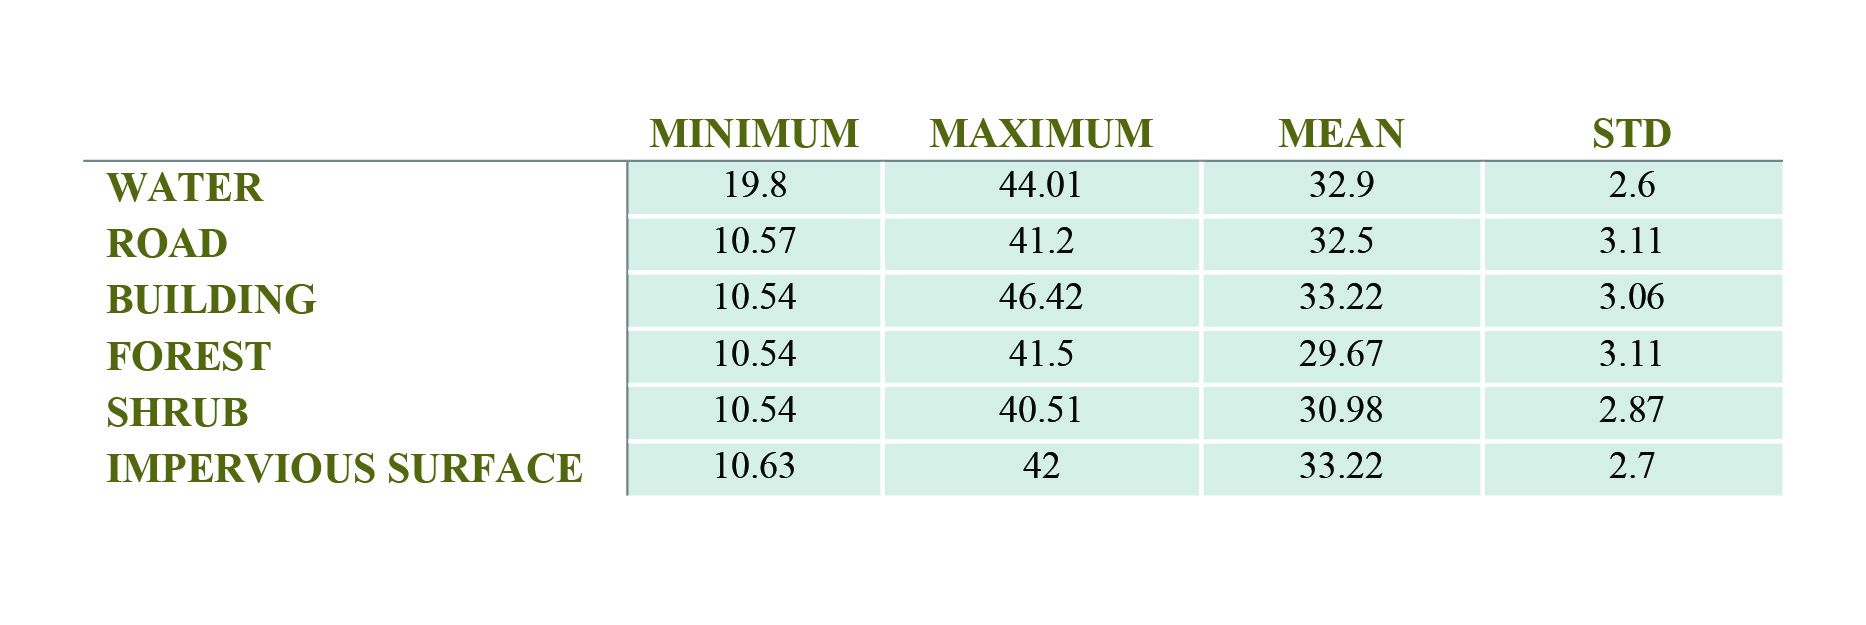
The analysis of Land Surface Temperature (LST) across different land-use types in Baltimore reveals distinct thermal characteristics. Water surfaces exhibited the lowest variability, with a mean LST of 32.9°C and minimal standard deviation (2.6°C), suggesting consistent cooling effects. Building and road surfaces showed the highest mean LST values at 33.22°C and 32.5°C, respectively, with maximum temperatures reaching up to 46.42°C for buildings, highlighting their role in intensifying Urban Heat Island (UHI) effects. Forest and shrub-covered areas demonstrated significantly lower mean LSTs of 29.67°C and 30.98°C, respectively, with negative impacts on thermal stress due to their cooling effects through shading and evapotranspiration. The variation in LST between land-use types underscores the importance of vegetation in mitigating UHI intensity, particularly in urban areas dominated by impervious surfaces such as buildings and roads. These findings highlight the need for targeted greening strategies in areas with high thermal stress.
3. Correlation of UHI Intensity with Land Use and Socioeconomic Patterns
Pearson’s correlation analysis was used to quantify the strength and direction of relationships between UHI intensity, land use, and socioeconomic variables in Baltimore. This statistical method allows for assessing linear dependencies, providing insight into which factors most significantly influence UHI. By understanding these correlations, we can identify critical drivers of UHI and design targeted mitigation strategies.
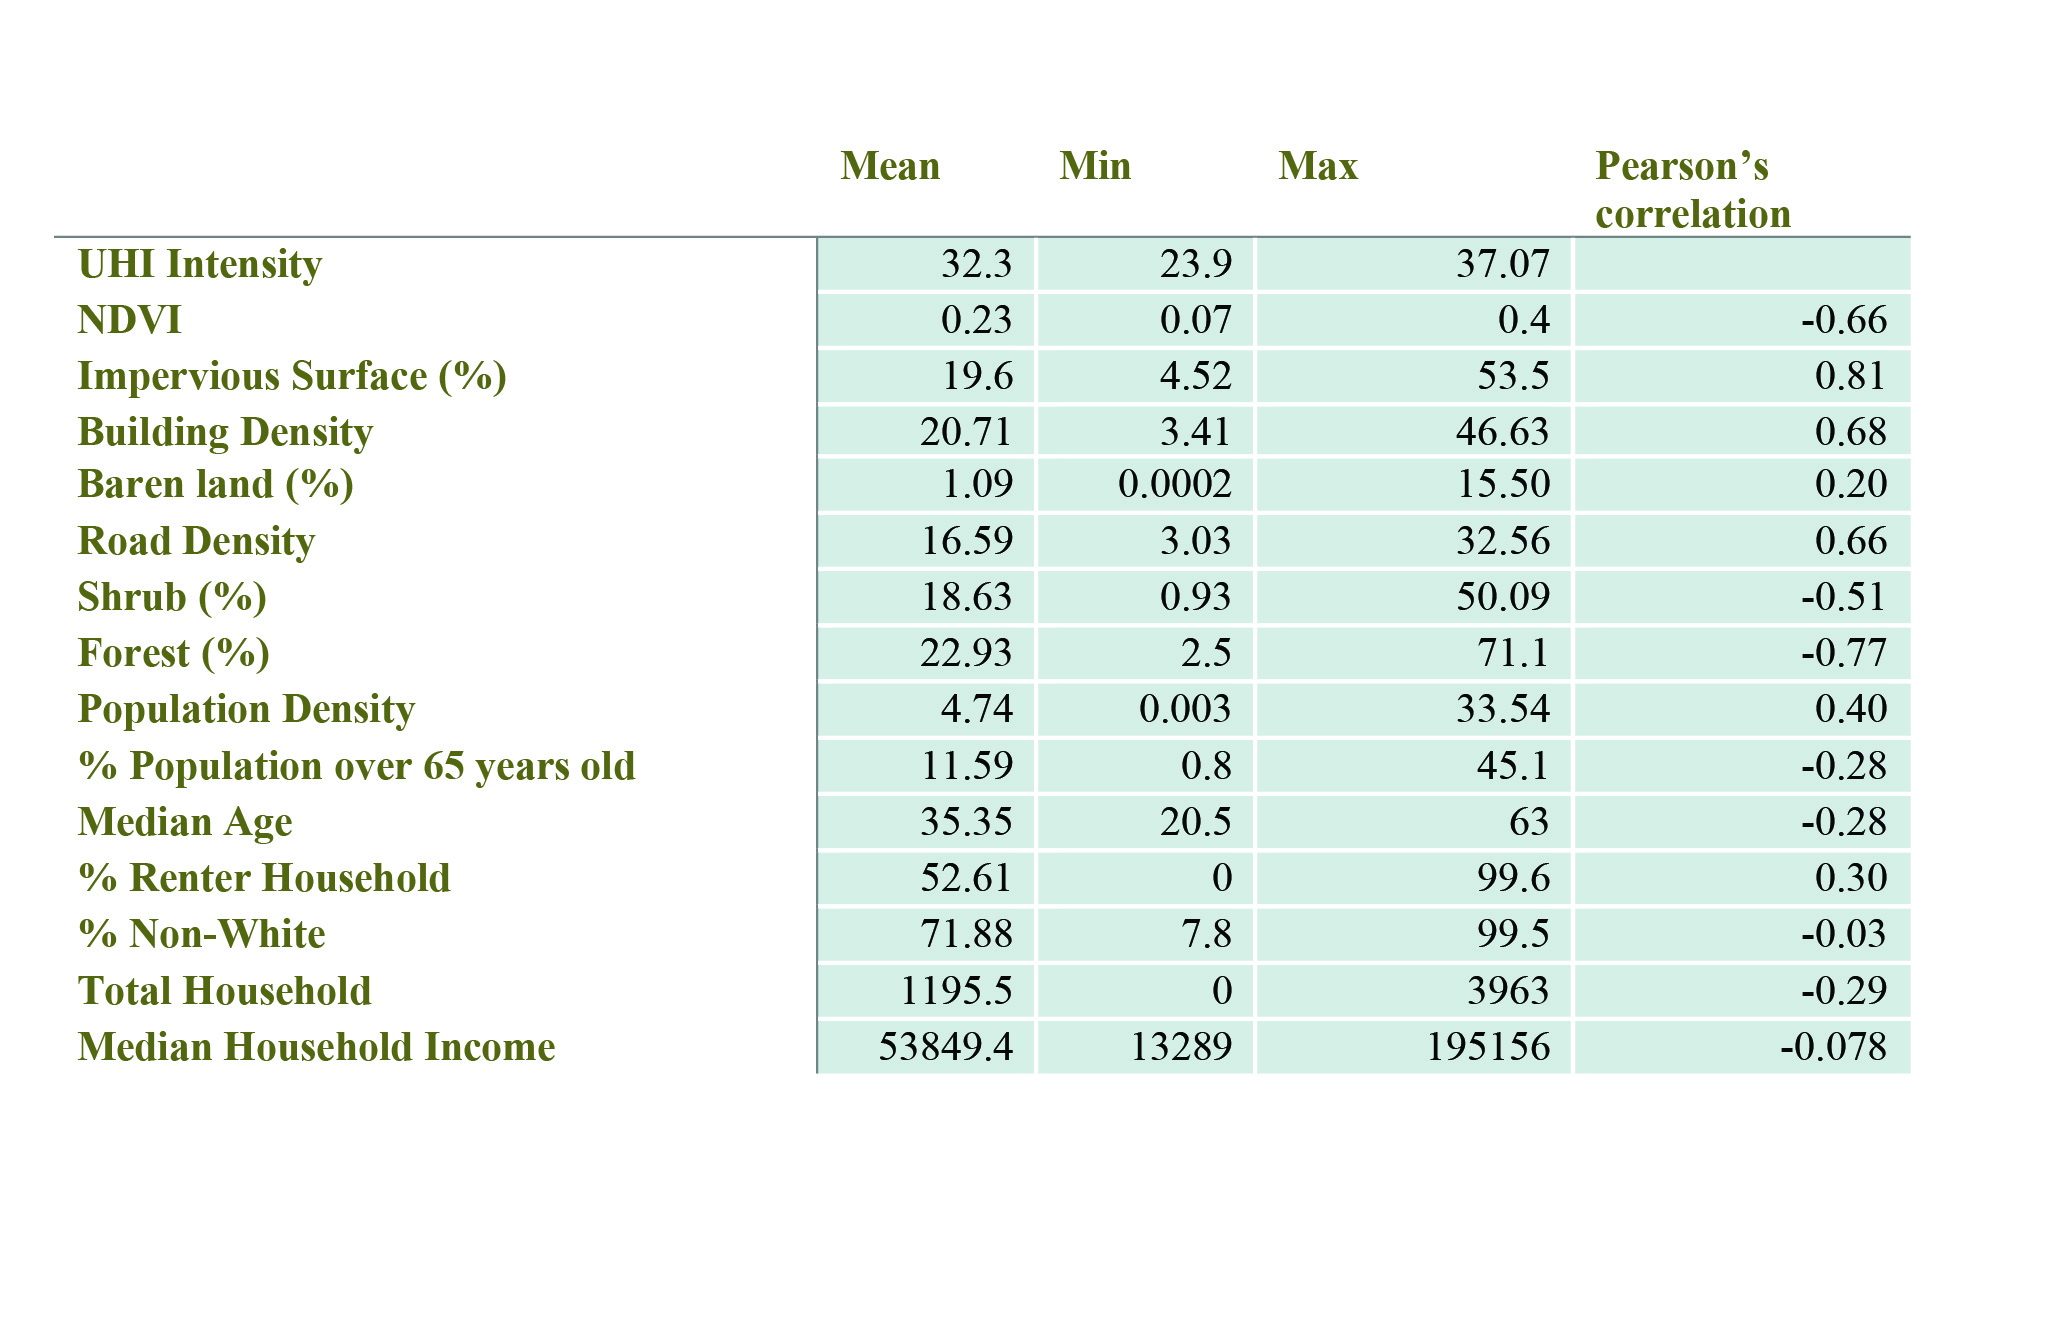
The analysis reveals strong positive correlations between UHI intensity and impervious surfaces (r=0.81), building density (r=0.687), and road density (r=0.669), indicating that built infrastructure significantly elevates surface temperatures. Population density (r=0.400) also shows a moderate positive correlation, while barren land has a weaker effect (r=0.203). Conversely, vegetation coverage, including forest percentage (r=−0.779) and shrub percentage (r=−0.511), exhibits strong negative correlations, highlighting vegetation's cooling role through evapotranspiration and shading.
Socioeconomic factors demonstrate more complex patterns. Weak negative correlations for median age (r=−0.284) and household income (r=−0.079) suggest indirect impacts, potentially linked to vegetation or infrastructure. Renter percentage (r=0.302) correlates positively, indicating UHI challenges in rental-dominated areas with less investment in greening. Additionally, racial and ethnic composition (r=−0.039) reveals equity concerns, warranting further study.
These findings underscore the importance of addressing UHI through targeted greening and equitable infrastructure planning, particularly in densely built and underserved areas.
4. Management Implications for Urban Climate at the Local Scale in Baltimore City
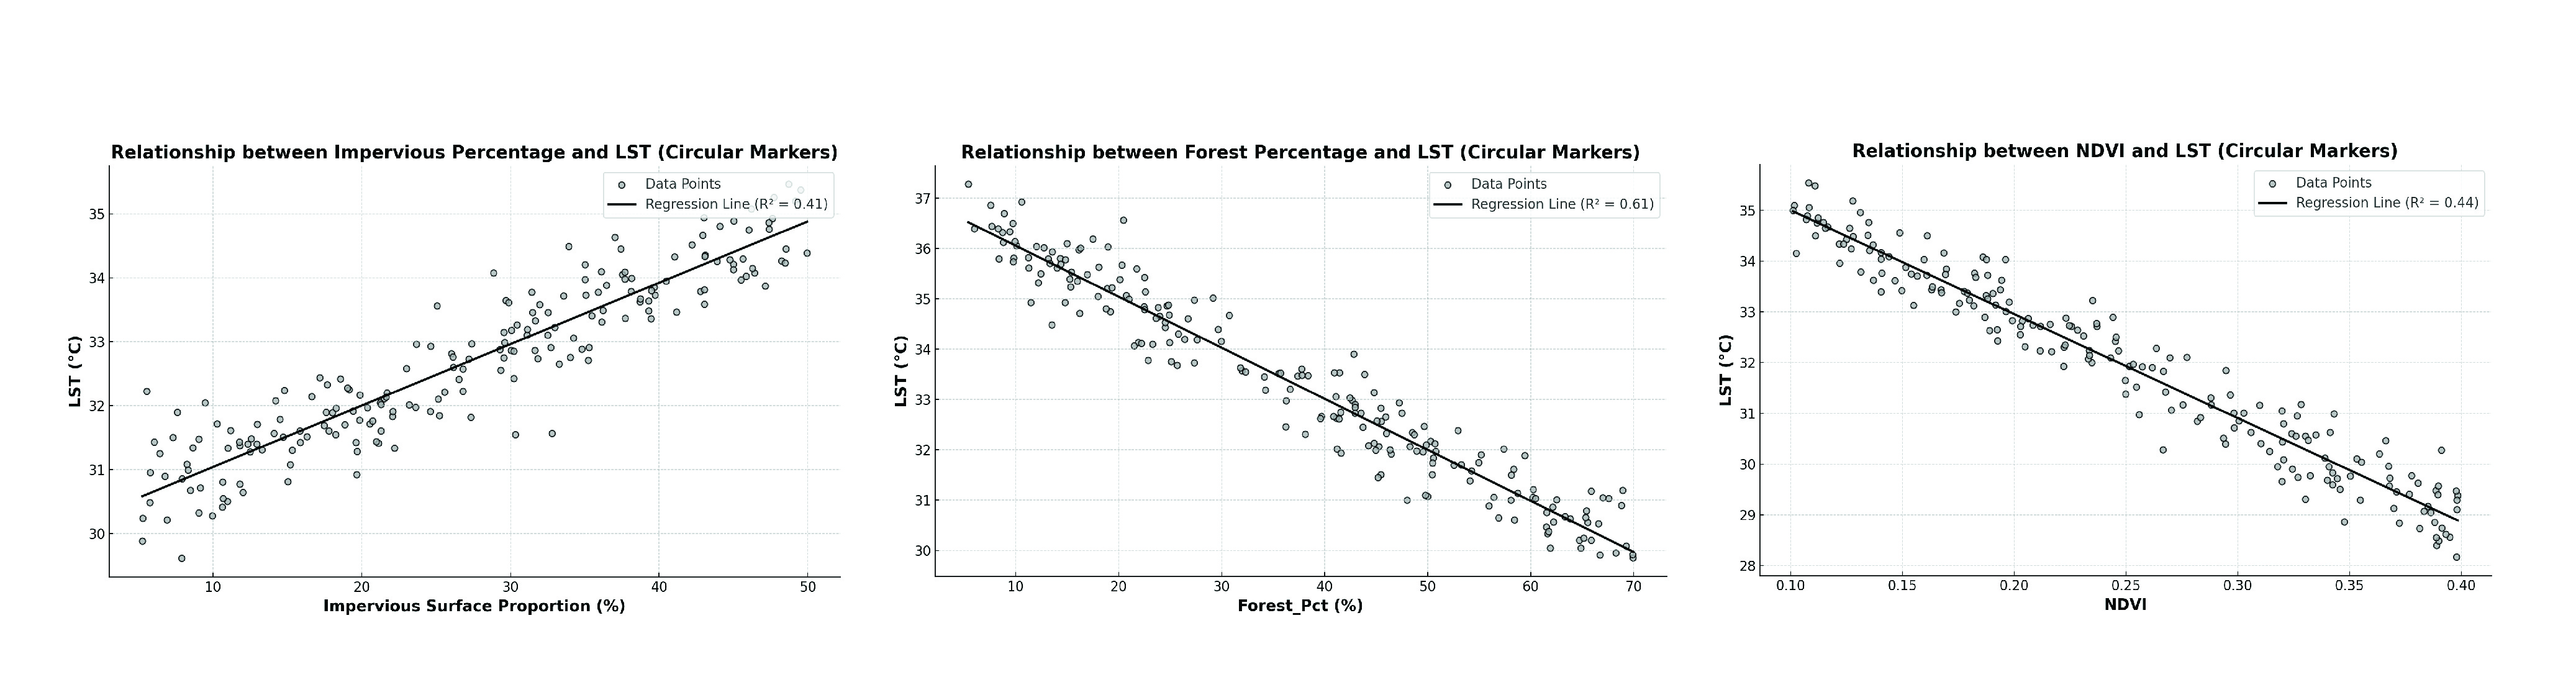
Urbanization drives significant environmental changes, impacting land surfaces, biodiversity, and urban life quality. In Baltimore, the Urban Heat Island (UHI) effect is closely linked to impervious surfaces (R²=0.41) and vegetation (NDVI, R²=0.44). A 10% increase in impervious surfaces corresponds to a 0.45°C rise in UHI intensity, underscoring the need for effective land-use management. Vegetation plays a critical role in UHI mitigation, with higher NDVI values reducing heat intensity, though areas with NDVI below 0.3 see weaker effects, highlighting the need for greening less vegetated neighborhoods. Forest coverage is most effective in reducing UHI when increased from 0% to 30%, with benefits tapering off beyond 40%. These findings emphasize the importance of strategic tree planting and vegetation enhancement in densely built urban areas to combat UHI and promote climate resilience.
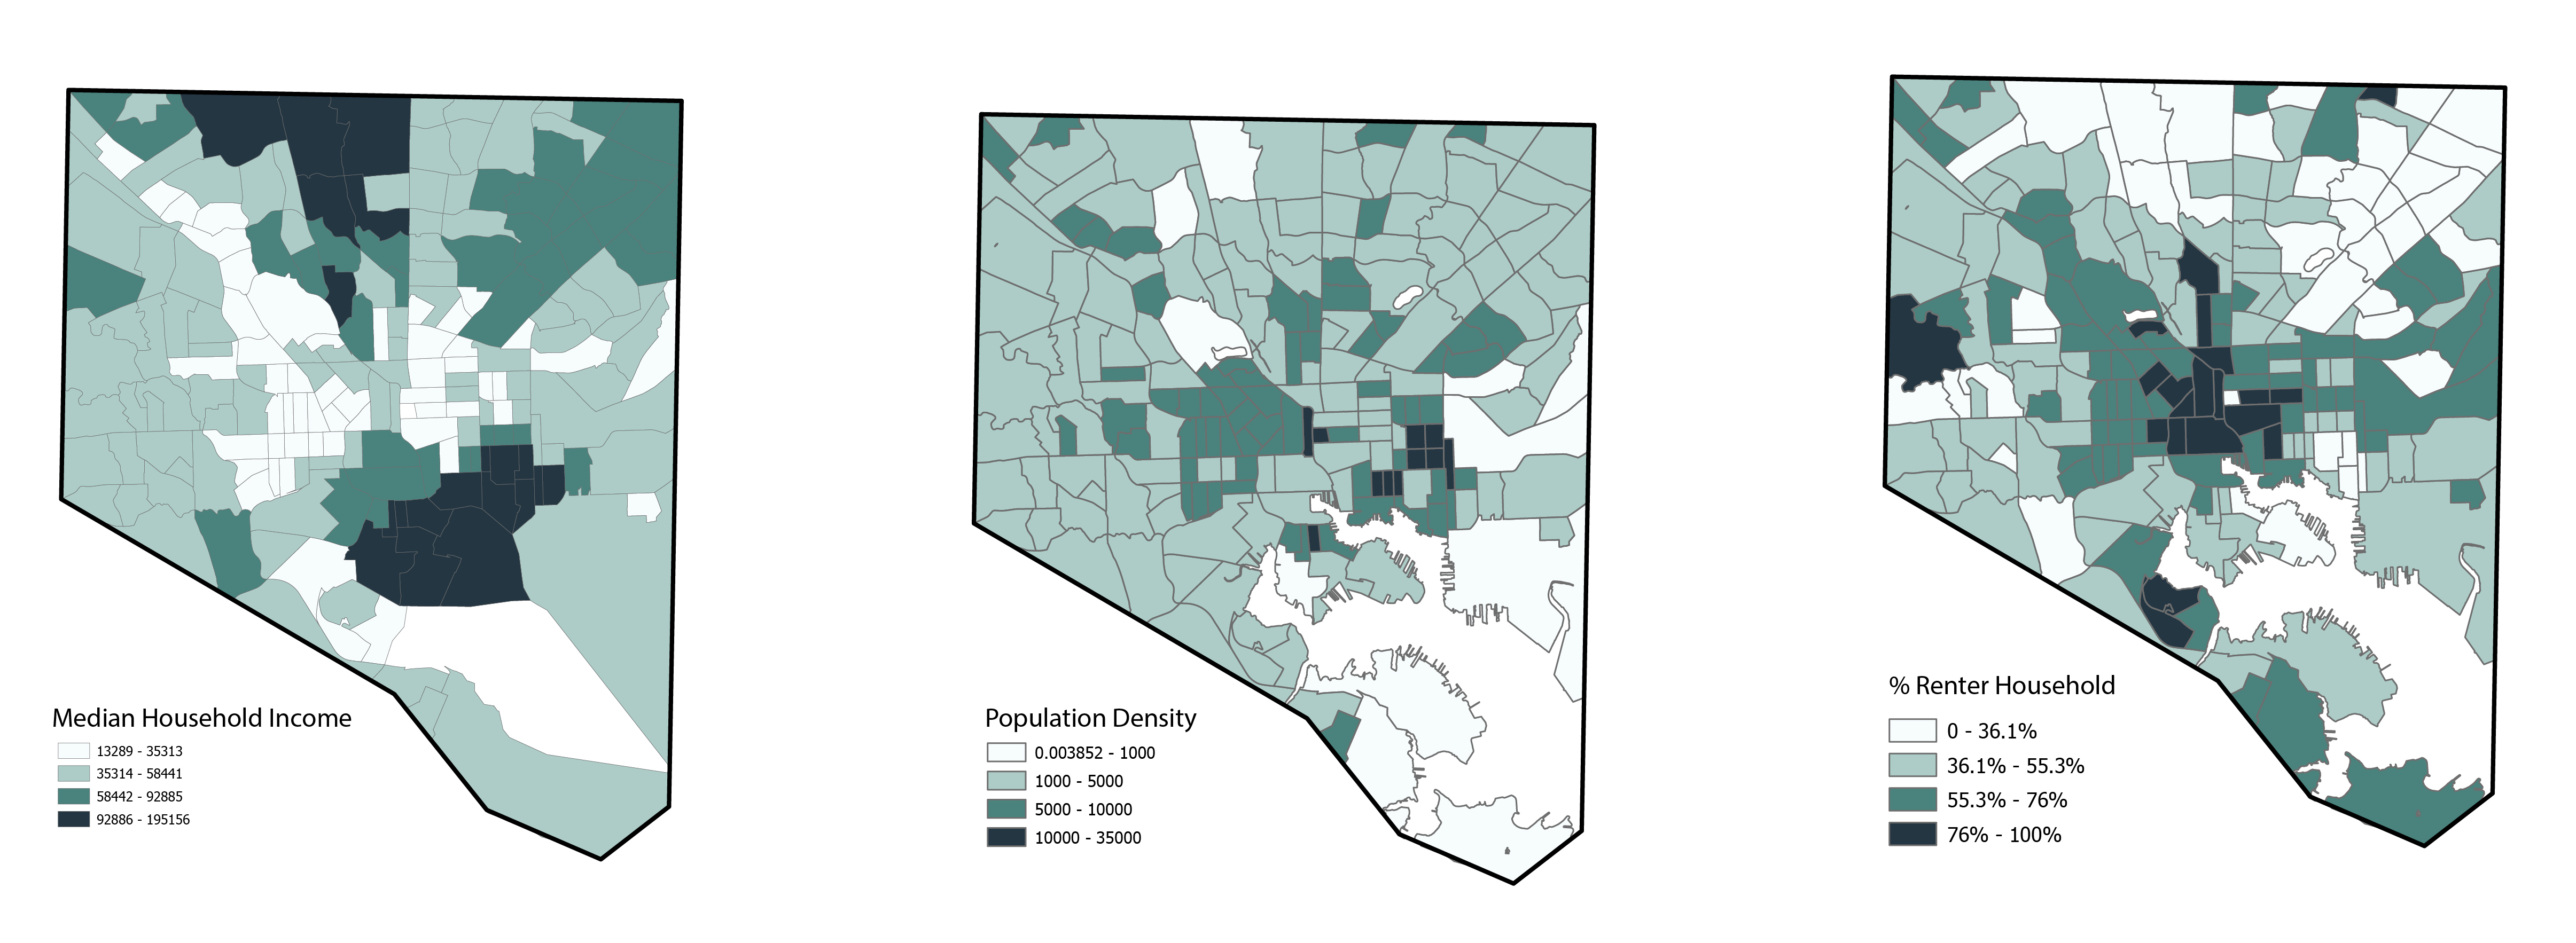
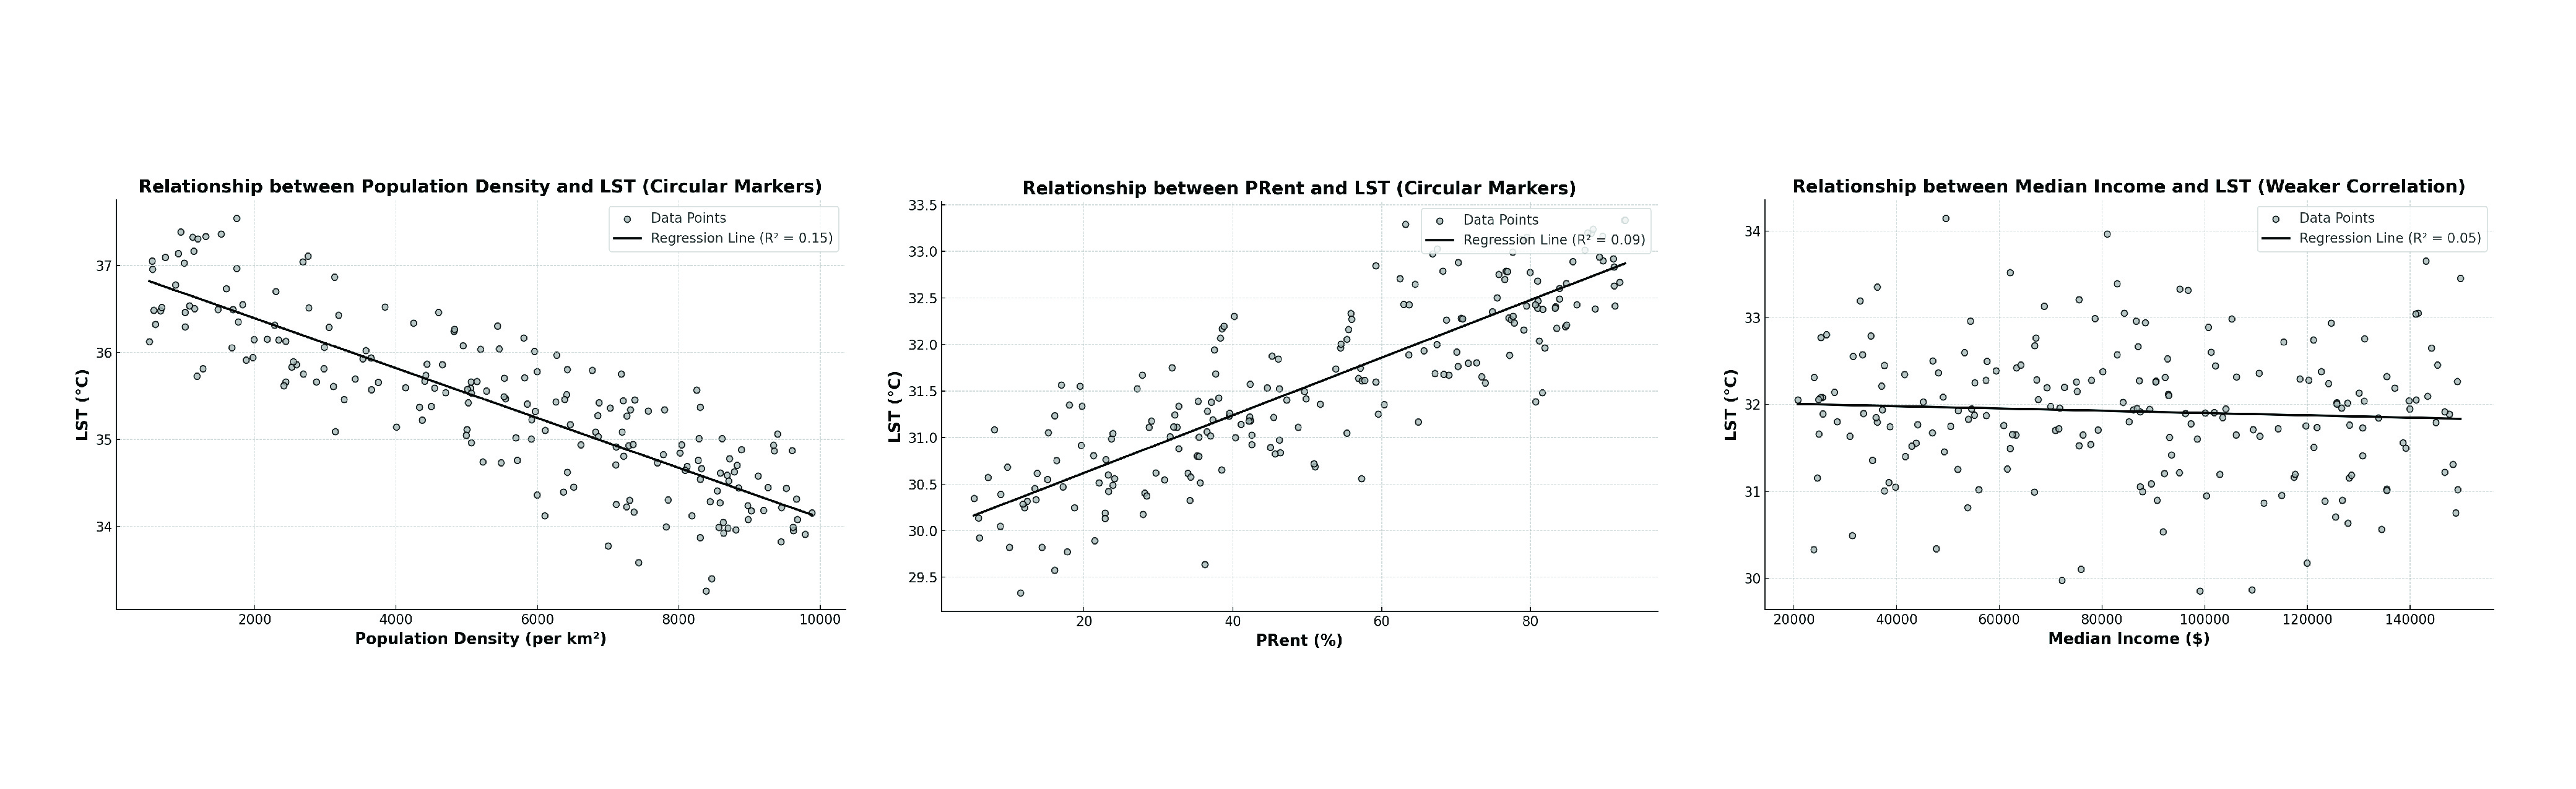
Socioeconomic variables exhibit complex relationships with UHI intensity. Population density correlates positively with UHI, especially in areas with densities between 0 and 5,000 persons/km², but this effect diminishes in neighborhoods exceeding 10,000 persons/km², likely due to cooling from nearby suburban areas. Median household income shows a negative correlation with UHI, particularly in neighborhoods with incomes below $100,000. Higher-income areas often have lower impervious surface coverage (average 12%) and more forest cover (average 28%), reducing UHI intensity. Rentership rates are positively correlated with UHI, as neighborhoods with high renter populations, typically in downtown Baltimore, tend to have limited green infrastructure.
These findings indicate that UHI intensity in Baltimore is influenced by multiple variables, including landscape patterns, vegetation cover, and socioeconomic factors, which interact in complex ways. To effectively mitigate UHI effects, urban planning must account for these direct and indirect interactions. Strategies should include reducing impervious surfaces, expanding tree canopies, and implementing equitable greening initiatives, particularly in socioeconomically disadvantaged neighborhoods. By integrating landscape and socioeconomic considerations, Baltimore can foster a more sustainable and livable urban environment while addressing climate inequities at the local scale.
5. Conclusion
This study analyzed the spatial variation of Land Surface Temperature (LST) and Urban Heat Island (UHI) intensity in the Baltimore metropolitan area, revealing that high LST areas are concentrated in downtown regions with extensive impervious surfaces and minimal vegetation. Impervious surfaces and NDVI were identified as the most influential factors shaping UHI intensity, while socioeconomic variables, such as population density, had indirect effects through their association with impervious surfaces. High-income, low-density areas with more vegetation exhibited reduced UHI intensity.